

Austin Housing Market Slows: June 2025 Market Flow Score Matches 2008
Published | Posted by Dan Price
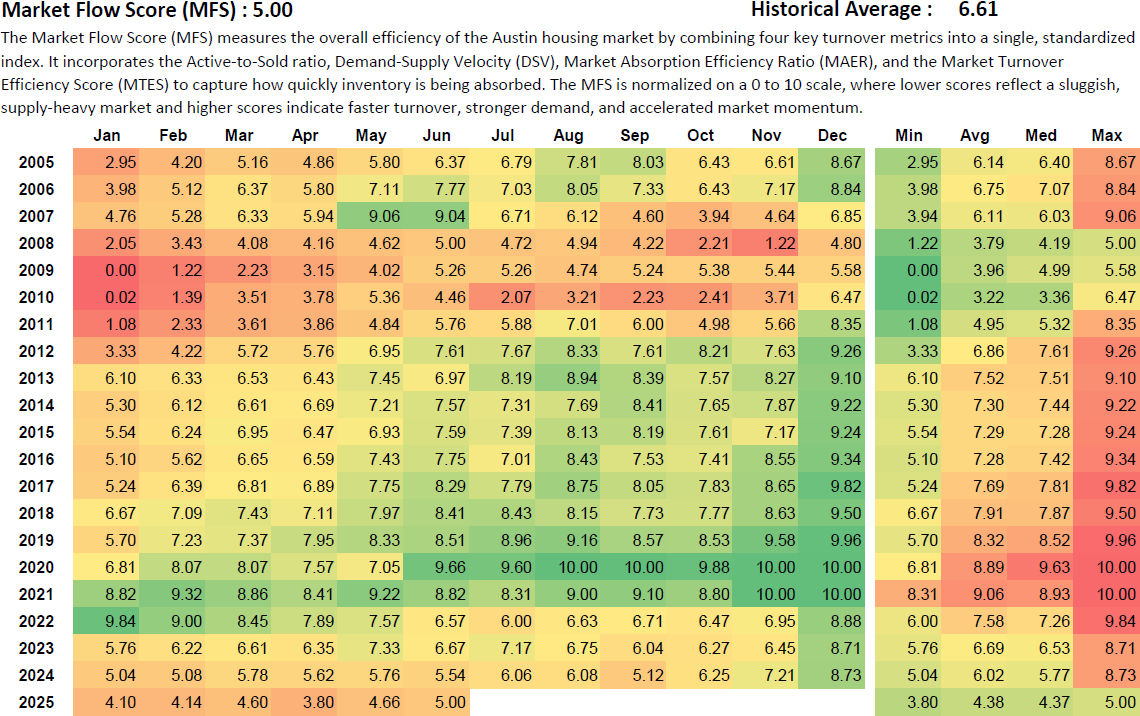
Austin's June 2025 Market Flow Score Matches June 2008, Signaling Market Slowdown
In June 2025, Austin’s housing market reached a significant milestone: the Market Flow Score (MFS) dropped to 5.00, matching the exact score recorded in June 2008, during the early phase of the Great Recession. The MFS is a composite index that measures how efficiently homes listed for sale are being absorbed by the market. It combines four key metrics: the Active-to-Sold Ratio, Demand-Supply Velocity (DSV), Market Absorption Efficiency Ratio (MAER), and the Market Turnover Efficiency Score (MTES). The score is normalized on a scale of 0 to 10, where lower numbers reflect slower turnover and buyer hesitation, while higher numbers indicate strong buyer demand and rapid listing conversion.
Historically, the average MFS for the Austin market is 6.61. A score of 5.00, while not alarming in isolation, is a clear indication that the market has slowed below its long-term average. More importantly, matching a level not seen since June 2008 draws direct comparisons to a time when the market was entering a prolonged period of inefficiency. In that year, the June MFS was also 5.00, during a stretch when the index ranged from a low of 1.22 to a high of 5.00 across all twelve months. The consistency in these data points reinforces the interpretation that June 2025 marks a slowdown in inventory absorption and buyer urgency.
The last time the MFS hit its peak was in 2020 and 2021. During those years, the index regularly exceeded 9.00, with several months peaking at the maximum score of 10.00. That period was defined by unprecedented demand, historically low interest rates, and rapid price appreciation. From 2015 through 2019, the MFS held comfortably in the 7.0 to 9.0 range, representing a steady, competitive environment with healthy absorption and active buyer pools.
The current trajectory, however, suggests a reversal. From the start of 2025, the MFS has declined each month: January 2025 scored 4.10, February was 4.14, March rose slightly to 4.60, and April dipped to 3.80. May recovered modestly at 4.66, followed by June’s return to 5.00. This level remains well below the historical norm and reflects buyer hesitation, affordability challenges, or inventory that is outpacing demand. While the MFS has not plummeted to the extreme lows of the 2009 market (which began at 0.00 in January), the comparison to June 2008 is still notable. That year, the housing market was cooling rapidly, with similar signs of reduced turnover.
Understanding the MFS helps interpret broader market health. In high-turnover environments, listings move quickly, and sellers maintain leverage. In contrast, a lower MFS like the current 5.00 score signals friction in the market. Buyers may be pulling back, homes may be lingering on the market longer, and pricing strategies may be slow to adapt. The downward trend in MFS from early 2025 indicates a buildup of this friction.
Though the MFS does not directly measure price changes, it is often a leading indicator. In previous cycles, extended periods of declining turnover efficiency preceded pricing plateaus or adjustments. Market observers, especially real estate agents and housing analysts, use the MFS to anticipate how quickly inventory might clear and where bottlenecks may emerge.
In summary, the June 2025 Market Flow Score of 5.00 carries historical weight. It reflects a notable cooling of market activity and mirrors conditions seen during a period of national housing instability in 2008. While not predictive of a crash, it is a data-driven signal that market participants—buyers, sellers, and professionals—should watch closely in the coming months to gauge the depth and duration of this shift.
FAQ Section
What is the Market Flow Score (MFS)?
The Market Flow Score (MFS) is a monthly indicator that measures how efficiently the housing market is absorbing inventory. It combines four metrics—Active-to-Sold Ratio, Demand-Supply Velocity (DSV), Market Absorption Efficiency Ratio (MAER), and Market Turnover Efficiency Score (MTES)—into a single 0–10 score. A higher score indicates fast inventory turnover and strong demand, while a lower score reflects market slowdown.
Why does a score of 5.00 matter in June 2025?
The June 2025 score of 5.00 is significant because it exactly matches the June 2008 score, a month that occurred during a broader housing market downturn. The match suggests that current market turnover efficiency is now at its lowest June level in 17 years and signals a marked slowdown compared to previous years.
How does the current MFS compare to historical averages?
The long-term average MFS for Austin is approximately 6.61. The current score of 5.00 is well below this average, indicating that homes are taking longer to sell and market activity has cooled. This makes it one of the lowest-performing Junes on record, only previously matched during the early stages of the 2008 correction
Is a low MFS always bad for the housing market?
Not necessarily. A low MFS can signal opportunity for buyers, especially in a market that had previously favored sellers. However, it also reflects slower momentum, which can affect pricing strategies, negotiation power, and time on market. For sellers and agents, it suggests a need for more competitive positioning.
What should sellers and buyers do when the MFS drops?
Sellers should reassess pricing, presentation, and timing strategies to stay competitive. Buyers may find better negotiation opportunities but should still monitor inventory quality and overall affordability. Real estate professionals can use the MFS as a tool to guide their clients based on real-time market flow and behavior.
Request Info
Have a question about this article or want to learn more?
