Austin Real Estate Weekly Market Update – November 20, 2025
by: Dan Price, Broker at Team Price Real Estate
Austin's leading data analysis brokerage, where data drives exceptional service
Published on: Thursday, November 20, 2025 at 10:36 am
The Austin housing market is progressing further into a supply-led cycle as inventory expands faster than demand absorbs it heading into late 2025. Active listings across the Austin-Area MLS are up 14.4% year over year, and Months of Inventory has climbed to 5.92—now sitting at one of the highest levels seen since pre-pandemic conditions. More listings and slower turnover mean longer marketing times and increased negotiation flexibility for buyers. Pricing momentum remains intact but not accelerating. Appreciation is occurring primarily at the upper end of the market, while median values show moderate growth, indicating stable demand but reduced urgency. The leverage balance has shifted steadily toward buyers, signaling that the region is moving out of a corrective cycle and into a normalization phase that favors informed pricing strategies rather than aggressive escalation.
Scroll down to view the full Austin Real Estate Market Statistics PDF for November 20, 2025.
Inventory Expansion and Market Rebalancing
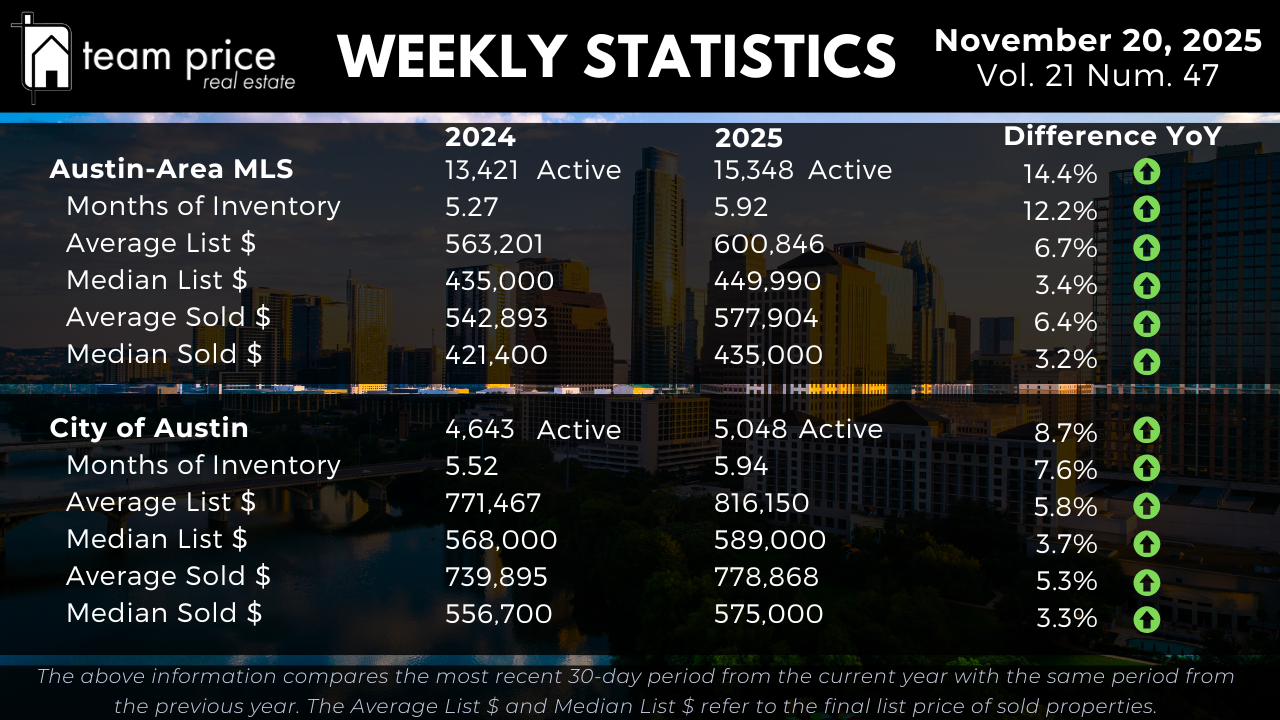
The Austin housing market continues to move further into supply-led conditions as inventory grows faster than demand absorbs it. Active listings across the Austin-Area MLS are up 14.4% year over year, rising from 13,421 to 15,348. Based on current absorption rates, Months of Inventory has increased from 5.27 to 5.92 — a 12.2% rise, or roughly a 1.1× increase in available supply compared with last year. This confirms longer marketing times and an expansion of buyer choice as the fourth quarter progresses.
Within the City of Austin, inventory growth is more moderate but still notable. Active listings increased 8.7%, from 4,643 to 5,048, while Months of Inventory climbed from 5.52 to 5.94, a 7.6% increase. The city is tracking in line with the metro-level supply expansion pattern, indicating a continued shift toward a balanced-to-softening environment.
Rather than a short-term fluctuation, the rise in supply remains part of a broader normalization process. Buyers now benefit from meaningful selection and additional leverage, while sellers must adjust through accurate pricing, competitive presentation, and disciplined timing.
Pricing Trends and Market Direction
Price levels remain stable with modest growth. Across the Austin-Area MLS, the average active list price increased 6.7% year over year, moving from $563,201 to $600,846. Median active list price rose 3.4%, from $435,000 to $449,990. Similar to previous months, pricing gains are more concentrated at the upper end, while median movement demonstrates broader market stability rather than acceleration.
Recent closing data reflects the same pattern. The average sold price increased 6.4% year over year to $577,904, while the median climbed 3.2% to $435,000. Within the City of Austin, the average sold price increased 5.3%, from $739,895 to $778,868. The median sold price improved from $556,700 to $575,000, a 3.3% rise year over year. These median-level increases indicate pricing equilibrium, where market participants are aligned and aggressive upward pressure remains contained.
Directionally, the price structure is holding steady. Sellers continue testing elevated list prices, but buyers remain highly value-aware. This is still a negotiation-first market defined by discipline rather than urgency.
Negotiation Environment and Buyer Leverage
Negotiation conditions continue to favor buyers. So far this month, 70.38% of all sold properties have closed below the list price (compared with 70.89% last month), while 18.86% closed at list and 10.76% above it. The slight uptick in over-ask closings reflects targeted competition where inventory is tight and listings are strategically positioned.
The average sold-to-list price ratio now stands at 97.08%, confirming sellers are conceding roughly 2.9% on average. This mirrors recent trendlines and reinforces that while concessions are standard, they have stabilized. Sellers who price accurately and present well still secure efficient outcomes; those who overshoot are encountering longer days on market and deeper adjustments.
Precision is now the operational advantage. Buyers hold leverage through wider selection and a slower pace of bidding, while sellers win when their pricing aligns with market reality.
Regional & ZIP Code Performance
Market behavior across Central Texas is balanced and data-driven. Month over month, 21 out of 30 tracked cities (70%) posted price increases, while 9 (30%) declined. Year over year, 16 cities (53%) have gained, and 14 (47%) have declined.
Among 75 ZIP codes, 39 (52%) show month-over-month price gains, while 36 (48%) are down. On a year-over-year basis, 38 ZIP codes (51%) are up and 36 (48%) are down. Only one ZIP code remains above its 12-month peak, while 74 are below, confirming widespread normalization and the conclusion of the corrective cycle.
Location-specific performance — particularly around affordability and school district alignment — now drives most variance, not broad-based market shifts.
Prices Relative to Peak Levels
Relative to recent peaks, the market remains well off surge-era highs but has clearly established stability. In the Austin-Area MLS: Average sold price is 13.2% below its May 2022 peak. Median sold price is down 19.1% from peak. Price per square foot remains roughly 20–22% below peak values, holding consistent with correction-level metrics seen in recent months.
Within the City of Austin: Median sold price is 15.4% below its May 2022 high. Average sold price is down 13.1% from peak. Price per square foot has declined between 22–26%, depending on average vs median. These declines are structural, not temporary. The market completed its downward reset long ago and is now operating in a steady post-correction environment.
Market Outlook
As of late 2025, the Austin housing market is stabilizing following a high-volume correction phase. Supply continues to grow at double-digit rates, yet pricing remains intact, and calibrated listings still find demand. Over-ask activity is rising incrementally but remains limited to micro-market pockets of scarcity and strong product alignment.
The path forward is clear: Buyers maintain control of timing and negotiation. Sellers succeed through accuracy, not optimism. Pricing is governed by value justification, not momentum. The market has transitioned out of volatility and into structured balance, building the foundation for a more predictable cycle as we move into 2026.
If this PDF does not display, click here to open in a new tab .
Austin Housing Market Questions : November 2025
What is the latest update on the Austin housing market?
The most recent data shows that the Austin housing market is shifting further into a supply-led phase as inventory expands faster than demand absorbs it. Across the Austin-Area MLS, active listings have increased 14.4 percent year over year, rising from 13,421 to 15,348. Months of Inventory is now at 5.92 compared to 5.27 this time last year, a 12.2 percent increase that represents roughly 1.1 times more available supply. In the City of Austin, active listings rose 8.7 percent from 4,643 to 5,048, and Months of Inventory moved from 5.52 to 5.94. This pattern confirms that properties are spending longer on the market and buyers have greater selection. From a pricing standpoint, the market remains stable. The average active list price increased 6.7 percent to $600,846 and the median active price rose 3.4 percent to $449,990. The average sold price climbed 6.4 percent to $577,904, and the median sold price grew 3.2 percent to $435,000. In the City of Austin, average sold price is up 5.3 percent year over year and the median sold price has increased 3.3 percent. The overall takeaway is clear: inventory is growing, absorption is slower, and prices are holding firm without signs of rapid acceleration or decline.
Are housing prices in Austin dropping?
Housing prices in Austin are not broadly declining, but they are no longer accelerating at the pace seen during the peak years. The market is showing mild appreciation at both the average and median levels. Across the Austin-Area MLS, the median sold price increased 3.2 percent year over year, and the average sold price rose 6.4 percent. In the City of Austin, the median sold price increased 3.3 percent, and the average sold price is up 5.3 percent. These figures indicate that while pricing pressure has cooled, the market is not moving into a decline pattern. Instead, pricing is stabilizing near current levels, reflecting balanced buyer and seller expectations. Declines are more likely to appear selectively, particularly in over-priced listings, homes lacking proper preparation, or locations with weaker demand. Overall, Austin is not experiencing systemic price contraction but rather modest and controlled movement consistent with normalization.
Is it smart to buy a house in Austin right now?
For many buyers, this is a strategically favorable time to enter the market. Conditions have shifted toward greater buyer leverage due to increased inventory and slower absorption, which reduces urgency and improves negotiation opportunity. The sold-to-list price ratio currently averages 97.08 percent across the MLS, meaning sellers are conceding close to three percent during negotiations. With months of inventory approaching six months and active listings up 14.4 percent year over year, buyers benefit from more choice and more time to evaluate properties without the pressure seen in prior years. The key factor is intent. Buyers planning for long-term ownership with stable financing conditions can take advantage of the current environment. Smart purchases rely on accurate valuation and discipline rather than haste. While mortgage rates remain elevated and affordability must be carefully considered, today’s market allows buyers to negotiate from strength and avoid the frenzied dynamics of previous cycles.
What is the real estate market in Austin 2025?
In 2025, the Austin real estate market is best described as entering a balanced-to-softening phase following the correction that initiated after the 2022 peak. Inventory growth has reached a double-digit rate, and Months of Inventory has risen to 5.92 across the MLS and 5.94 within the City of Austin. Prices are still rising year over year—average sold prices increased between 5.3 and 6.4 percent in both the metro and city, and median sold prices grew between 3.2 and 3.3 percent. While appreciation is present, momentum has clearly shifted toward moderation, and buyers are now in a stronger bargaining position. For most of the region, price movement is aligned with a normalization cycle rather than a high-growth trend. This phase rewards accurate pricing strategy and professional presentation. For agencies and teams focused on data, process, and contract accuracy, 2025 is an operational market rather than a momentum market.
Is Austin, TX still booming?
Austin is no longer experiencing the explosive growth phase that characterized the 2020 to 2022 period, but it remains a fundamentally strong market. The rapid appreciation wave has transitioned into a more sustainable cycle defined by balance, segmentation, and disciplined pricing. Economic fundamentals, population growth, and long-term demand drivers remain intact, but housing activity has moved away from surge-level performance. With inventory expanding 14.4 percent year over year and marketing timelines increasing, the competitive pressure that once drove multiple-offer scenarios across the board has subsided. Instead, today's market requires strategic preparation, pricing accuracy, and product alignment with buyer expectations. Austin is still growing, but not booming. The cycle has shifted from momentum-powered expansion to data-driven stabilization. That shift benefits well-prepared agents and informed clients and signals a more predictable and sustainable market environment heading into 2026.